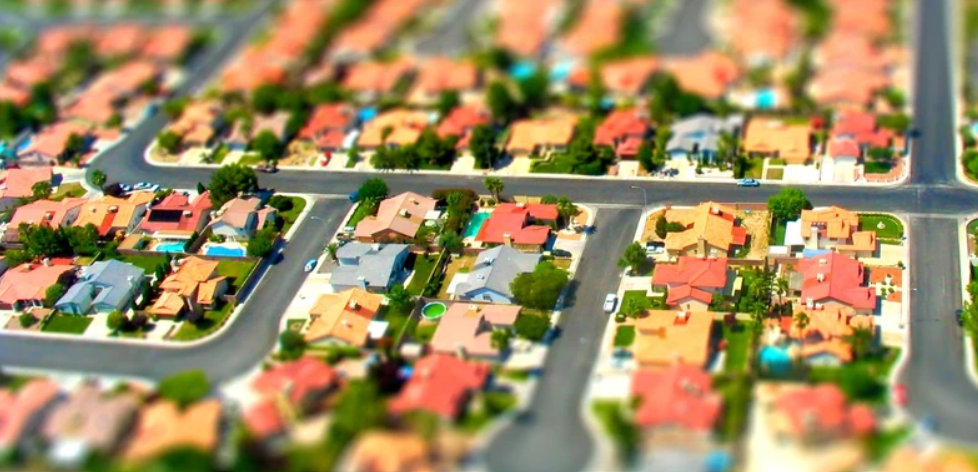
Data Cleaning in SQL
In this project, we take raw housing data and transform it in SQL Server to make it more usable for analysis. We use make use of Joins, Update, Partition, and many more tools to clean the data.
Data Analyst well versed in R, Python, SQL, MS Office, Power BI, and Tableau @kashif97
In this project, we take raw housing data and transform it in SQL Server to make it more usable for analysis. We use make use of Joins, Update, Partition, and many more tools to clean the data.

Python
In this project, we explore a dataset scrapped from IMDb website and perform data analysis on 4 decades worth of movies to answer some questions. We specifically explore and visualize correlations between different elements. We make use of Pandas, Numpy to clean the data and produce correlation visualization like heatmaps.
R Programming
A six-stage process of Prepare, Process, Explore, Analyse, Share, and Act. We work with a user-generated data from the bike riders of a bike-sharing company to recommend next year's promotion campaign. We make use of R in Kaggle.

Tableau
In this project, We analyze the data from Airbnb on house rentals and create dashboard using Tableau.
Power BI
In this project, we work with a survey data to draw insights about the partcipants' job using Power BI.

SQL
In this project, we use SQL Server to explore global COVID 19 data from World Heath Organization and draw insights. We make use of Join, CTE's, Temp Tables, and many more.

Python
In this project, we follow the PACE framework to inspect and analyze the data for the New York City Taxi and Limousine Commission (New York City TLC) to develop data-based solutions.
Tableau
We roleplay as a BI candidate and we create a dashoard/story to analyze the customers' calling pattern. The Google Fiber team's goal is to communicate with the customers to reduce the call volume and increase customer satisfaction and improve operational optimization.
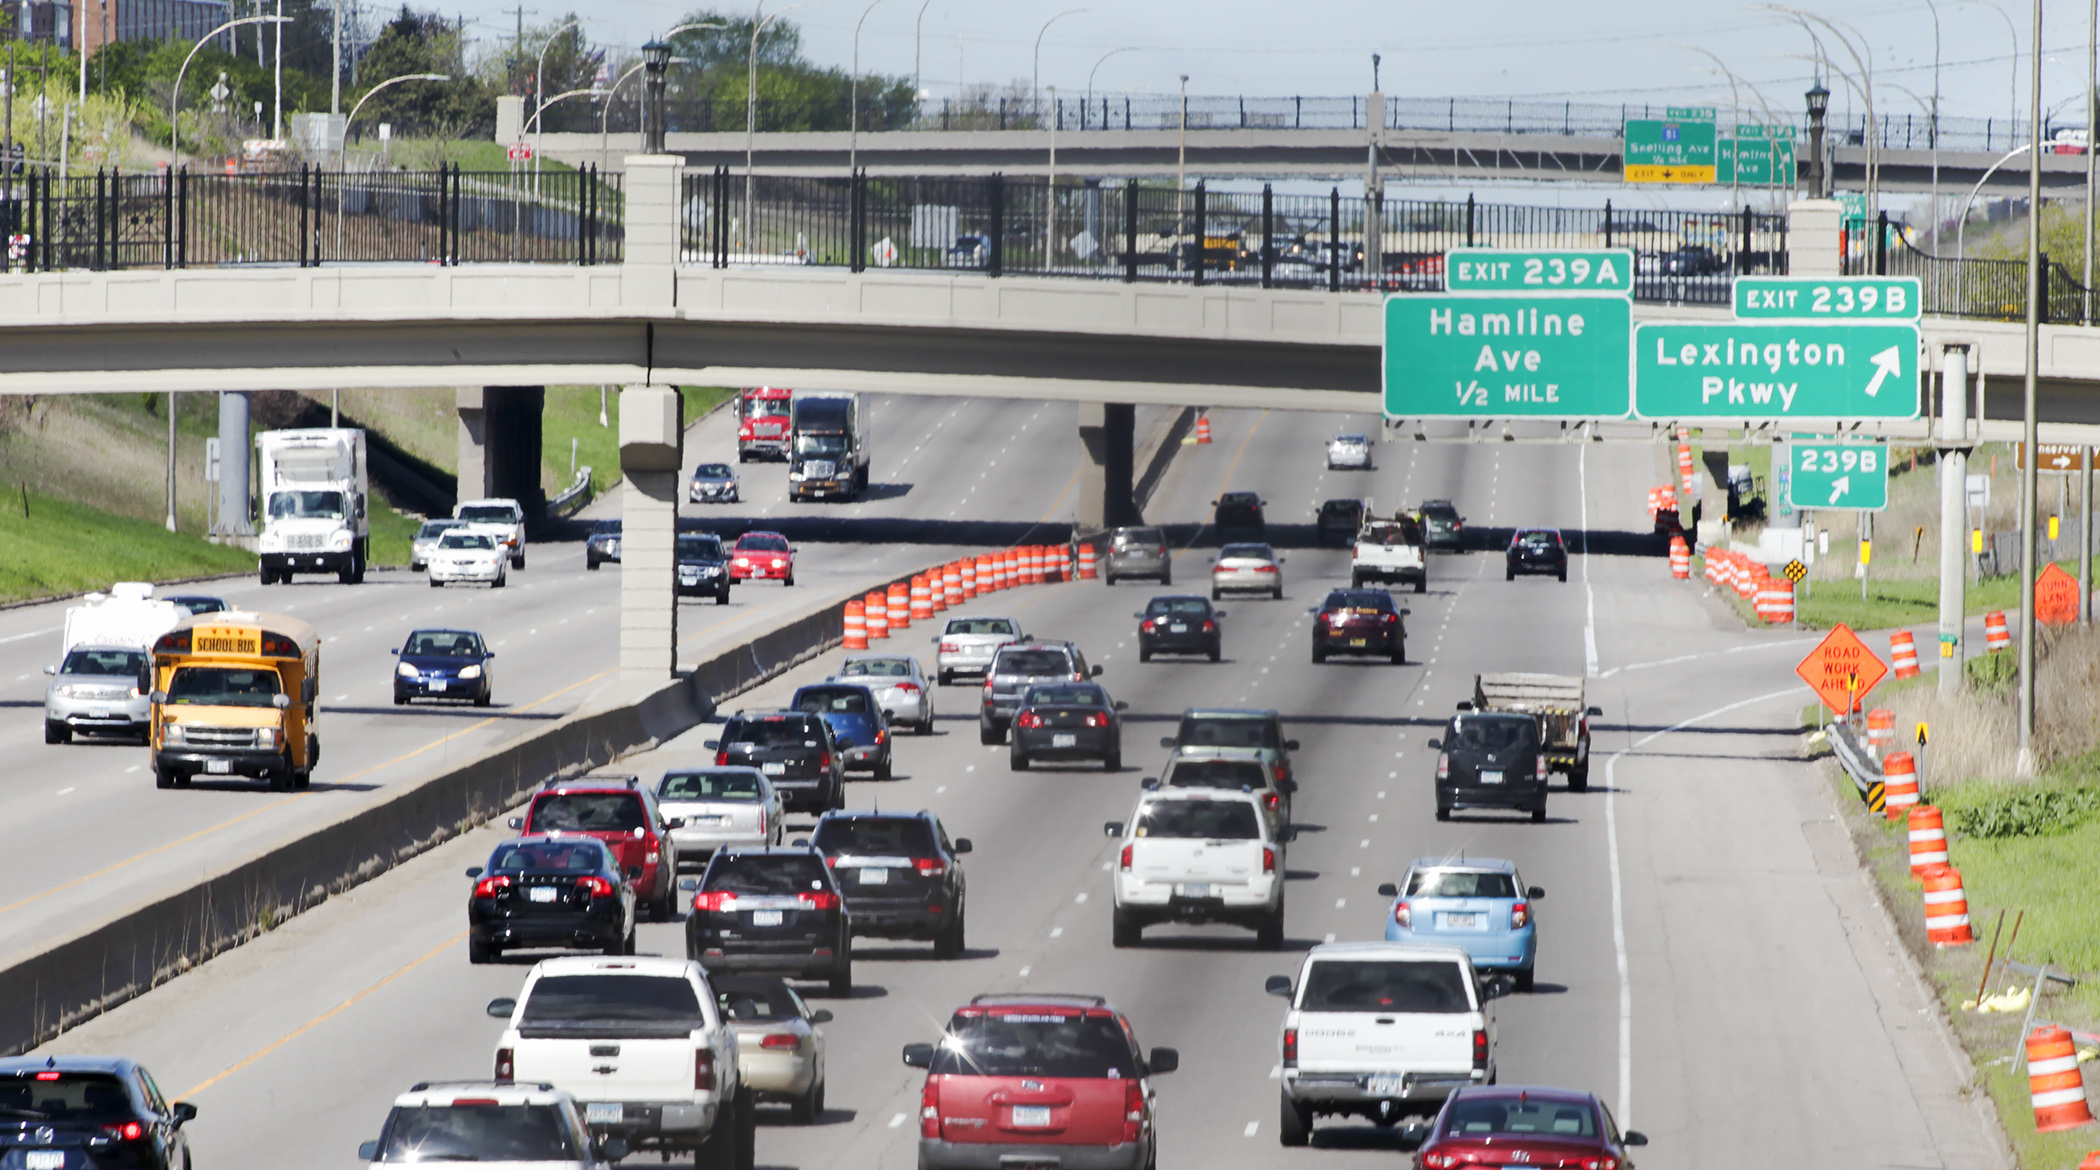
Tableau
Using Tableau, we create a dashbaord to answer three key questions asked by The Minnesota Department of Transportation to help their team monitor traffic patterns